Intro to Recommendation Engines

A recommender system is a system that predicts ratings or preferences a user might give to an item. Often these are sorted and presented as top-N recommendations. Also known as recommender engines, recommendation systems or recommendation platforms.
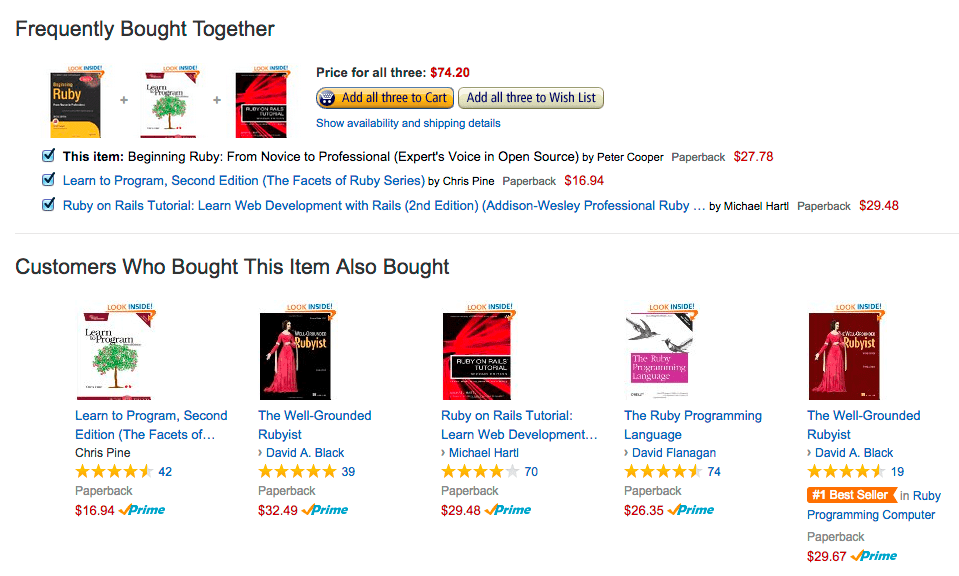
Recommender systems are completely data driven. They find relationships between users and between items just based on actions. Usually there is no human curation involved at all. For example if you were to purchase a gaming system on a website like amazon you would see products like controllers, games or a headset recommended to you. The recommender system understands statistically people who buy a gaming system also buy controllers and it can use those historical patterns to show customers things before they even want it.
Use cases for recommender systems
- Recommending products: Items in an online store like amazon
- Recommending content: News articles or or YouTube videos
- Recommending Music: Apps like Pandora or Spotify
- Recommending people: Online dating websites like e-harmony or match
- Personalizing search results: Google or Bing
Recommender systems are everywhere and can have a significant impact on a companies sales.
How do recommender systems work?

Its all about understanding the user, visitor or customer. A recommender system with some sort of data about every user that it can use to figure out that users individual tastes and preferences. Then it can merge the data about you along with the collective behaviour's or everyone else's similar to you to then recommend things you may be interested in.
Understanding your users through feedback
There are $2$ main ways to understand your users or customers through feedback:

Explicit ratings
An example of explicit ratings would be asking a customer to rate a product or service $1$ to $5$ stars or rating content they see with a like or dislike. In these cases you are explicitly asking you customers do you like this content your looking at or did you enjoy this product or service. You would then use this data to build a profile of the users interest.
The drawback from explicit ratings is that it requires extra work from your users. Not everyone will want to be bothered with leaving a rating on everything they see from you business so this data is often very sparse. When the data is to sparse it diminishes the quality of you recommendations. Also people have different standards, meaning a $4$ start review may mean different things between $2$ different people. There could also be cultural differences in ratings between countries.
Implicit Ratings
Implicit ratings look at the things you naturally do when browsing and using products and services and interpreting them as indications of interest or disinterest. For example clicking a link on a web page and the content it points to could be considered a positive implicit rating or clicking on an ad may tell an ad network that you might find similar ads appealing.
Click data is great because often there is lots of it but clicks aren't always a reliable indication of interest. People often click on things by accident or may be lured into clicking on something because of the image associated with it. Click data is also highly susceptible to fraud because of the amount of bots that exist on the internet doing various things that could pollute your data.
Things you purchase are a strong indication of interest because actually spending your money is a strong indication that you are interested in something. Using purchases as positive implicit ratings is also very resistant to fraud. Someone trying to manipulate a recommender system based on purchase behavior will find it extremely expensive because of the amount of stuff that would have to be bought to effect its results.
Things you consume is also great for implicit ratings. For example YouTube uses minutes watched heavily as an indication of how much you enjoyed a video. Consumption data doesn't require your money but it does require your time so its also a more reliable indication of interest compared to click data.
Content-based and Collaborative Filtering

Content-based Filtering: Content-based filtering uses item features (attributes that best describe that item) to recommend other items similar to what the user has purchased or liked, based on their previous actions or implicit/explicit feedback.
Collaborative Filtering: Collaborative filtering uses similarities between users and items simultaneously to provide recommendations. This allows for serendipitous recommendations; that is, collaborative filtering models can recommend an item to user $A$ based on the interests of a similar user $B$.
Top N Recommender's
Top N recommenders produce a finite list of items to display to a given user or customer. Many recommender systems research tends to focus on predicting the ratings good or bad that a user will give to items they haven't seem yet. Customers don't want to see your ability to predict their ratings on items. Ultimately the goal is to put the best content in front of customers helping them to find things they need or will enjoy.
Top N Recommender's architecture

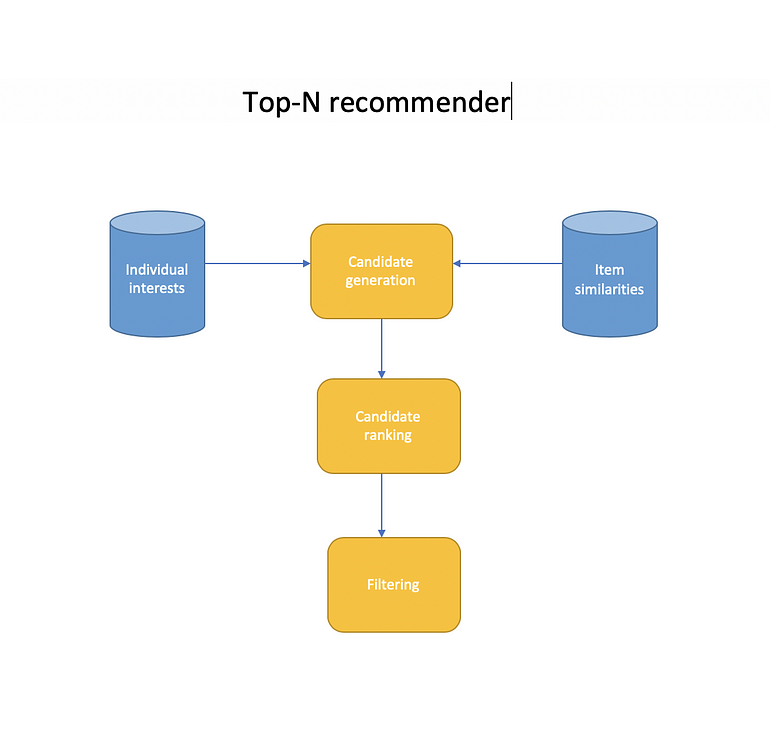
- Individual interest: A data store of product ratings and past purchases. This is usually a large distributed NoSQL (transactions) data store like MongoDB or AWS DynamoDB. Ideally this data is normalized using mean centering or z-scores to ensure comparability between users but the data is often to sparse to normalize effectively.
- Candidate Generation: Items we think might be interesting to the user based on their past behavior. So this process might take all the items a user indicated interest in before and consult with another data store of items that are similar to those items based on aggregate behavior.
- For example if a customers has shown interest in Star Trek items from the Individual Interest database. Based on everyone else's behavior you can conclude that people that like Star Trek also like Star Wars. So based on the customers interest in Star Trek they might get some Star Wars recommendation candidates. In the process of building up those recommendations you might assign scores to each candidate based on how the customer rated the items they came from and how strong the similarities are between the item and the candidates that came from them. You might even consider filtering out candidates based on a score if its not high enough at this stage.
- Candidate Ranking: Many candidates will appear more than once and need to be combined in some way. Their score could be boosted in the process because of repeated occurrences. After that it could just be a matter of sorting the recommendation candidates by scores to get the first iteration of a top-N list of recommendations.
- Machine learning is often employed here to learn how to optimally rank the candidates at this stage. This stage may also have access to more information about the recommendation candidates that it can use such as average review scores that can be used to boost results for highly rated or popular items.
- Filtering: Here we might filter out items a user has already rated since we don't want to recommend things the user has already seen. A stop list may also be applied here to remove potentially offensive items to the user or remove items that are below some quality metric or rating threshold. We also apply cut off results at this stage if we end up with more than we actually need.
- The output of the filtering stage is then handed down to a display layer on your platform as an attractive presentation of the personalised list to the user.

- The candidate generation, ranking and filtering will reside in some distributed recommendation web service that your web front end talks to in the process of rendering a page for a specific user.

- In the architecture above a database is created ahead of time of predicted ratings of every item for every user. The candidate generation phase here is just retrieving all of the given rating predictions for a given user for every item and ranking is just a matter of sorting them. This method requires you to look at every single item in your catalog for every single user which can be very inefficient at runtime for a large diverse number of items.
Evaluating Recommender Systems
Mean absolute error MAE:
$$ \mathrm {MAE} ={\frac {\sum _{i=1}^{n}\left|y_{i}-x_{i}\right|}{n}}$$- $n$ number of ratings in test set to evaluate
- $y_{i}$ each rating our system predicts
- $x_{i}$ ratings the users actually gave
- take the absolute value of the difference between $y_{i}$ and $x_{i}$ to measure the error for that rating prediction
- Sum the errors up across all $n$ ratings in the test set and divide by $n$ to get the average or mean
MAE Example:
| Predicted Rating | Actual Rating | Error |
|---|---|---|
| 5 | 3 | 2 |
| 4 | 1 | 3 |
| 5 | 4 | 1 |
| 1 | 1 | 0 |
- $\text{MAE} = (2+3+1+0)/5 = 1.5$
Root Mean Square Error (RMSE):
$$ \operatorname {RMSE} ={\sqrt {\frac {\sum _{i=1}^{n}({y}_{i}-x_{i})^{2}}{n}}} $$- Penalizes you more when your rating prediction is far from the actual rating and penalizes you less when you are reasonably close.
- The difference from MAE is instead of summing the absolute values of the ratings errors we sum up the squares instead. Taking the square insures we end up with positive numbers similar to absolute values and it also inflates the penalty for larger errors.
- Finally we take the square root to get to a reasonable number.
RMSE Example:
| Predicted Rating | Actual Rating | $\text{Error}^2$ |
|---|---|---|
| 5 | 3 | 4 |
| 4 | 1 | 9 |
| 5 | 4 | 1 |
| 1 | 1 | 0 |
- $\text{RMSE} = \sqrt{(4+9+1+0)/5} = 1.87$
Hit Rate (HR):
$$ \frac{hits}{users}$$You generate top-N recommendations for all users in your test set. If one of the recommendations in a users top-N recommendations is something they actually rated you consider that a hit.
You add up all the hits for all the users in your test set and divide by the number of users
Measuring Hit Rate:
- You cannot use the standard train/test split or $k$ fold cross-validation approach used for error metrics like MAE and RMSE because we are not evaluating prediction error on individual ratings. Instead we are measuring the accuracy of our generated top-N lists for individual users.
Leave-one-out cross-validation:
- With leave-one-out cross-validation you compute the top-N recommendations for each user in your training data and intentionally remove one of those items from that users training data. Then you test your recommender systems ability to recommend that item in the top-N list of results it creates for that user in the testing phase.
- So you measure your ability to recommend an item in a top-N list for each user that was left out in the training data. The trouble is its difficult to get one specific item correct while testing than to just get one of the N recommendations. So hit rate with leave one out tends to be very small and difficult to measure unless you have a very large dataset.
Average reciprocal hit rate (ARHR):
$$ \text{ARHR} = \frac{\sum_{i=1}^{n} \frac{1}{rank_{i}}}{Users} $$- Very similar to hit rate but ARHR accounts for where in your top-N list your recommendations appear. So you get more credit for successfully recommending an item in the top slot than in the bottom slot.
- With ARHR instead of summing up the number of hits we sum up the reciprocal rank of each hit.
Example:
| Rank | Reciprocal Rank |
|---|---|
| 3 | 1/3 |
| 2 | 1/2 |
| 1 | 1 |
- Here you see if we successfully predict a recommendation in slot $3$ that only counts as $1/3$ but a hit in slot $1$ of our recommender's top-N list receives the full weight of $1.0$
Cumulative hit rate (cHR):
| Hit Rank | Reciprocal Rank |
|---|---|
| 4 | 5.0 |
| 2 | 3.0 |
| 1 | 5.0 |
| 10 | 2.0 |
- Here you just throw away predicted ratings below some chosen threshold.
| Hit Rank | Reciprocal Rank |
|---|---|
| 4 | 5.0 |
| ~2~ | ~3.0~ |
| 1 | 5.0 |
| ~10~ | ~2.0~ |
- In the example above if we had a cutoff of $3$ stars we would throw away the hits for the 2nd and 4th items in the test results and our hit rate metric would not account for them at all.
Rating hit rate (rHR):
| Rating | Hit Rate |
|---|---|
| 5.0 | 0.001 |
| 4.0 | 0.004 |
| 3.0 | 0.030 |
| 2.0 | 0.001 |
| 1.0 | 0.0005 |
- Rating hit rate breaks ratings down by predicted ratings score. This can be a good way to get an idea of the distribution of how good your model thinks recommended items are that actually get a hit. Ideally you want to recommend items that the user actually liked and breaking down the distribution gives you some sense of how well your model is doing in more detail.
Coverage:
- The percentage of possible recommendations that your system is able to provide.
- Coverage can be at odds with accuracy. If you enforce a higher quality threshold on the recommendations your accuracy may improve at the expense of coverage.
- Coverage is also good to monitor because it gives you a sense of how quickly new items in your catalog will start to appear in recommendations.
Diversity:
$$(1 -S)$$- $S$ = average similarity between recommendation pairs.
- Diversity is the opposite of average similarity
- Diversity is how broad of a variety of products your recommender system is showing your users.
- Diversity is not always necessarily a good thing. Very high diversity can be achieved from recommending completely random items.
Example:
- Low Diversity: Simply recommending the next movie or book in a series but not recommending from different authors or directors.
Novelty:
- Mean popularity rank of recommended items.
- How popular the items are that you are recommending. Again recommending random things could yield a very high novelty score since the majority of items are not top sellers.
- There is a concept of user trust in a recommender system. Customers want to see at least a few familiar items in the top-N list that reassures them that they are seeing a quality list. If you only recommend items the customer isn't aware of they may not feel as comfortable with the list and are less likely to engage with the items on that list
- Popular items are usually popular for a reason. A large proportion of your customers enjoy those products so it would be expected for popular items to be good recommendations for a large segment of the population who has not yet seen those popular items yet.
- A good recommender system should have some popular items in the final top-N list. There needs to be a good balance between popular items and serendipitous discovery of new items the user has yet to see.
The long Tail
- Distribution of every item in your catalog sorted by sales. This is more than likely an exponential distribution. Most sales come from a smaller proportion of items (the head) but the long tail also makes up a large amount of sales as well.
- Novelty is important because the goal of a recommender system is to surface items in the long tail.
- Items in the long tail cater to people with unique niche interest. Recommender systems help customers discover those items in the long tail that are relevant to their own unique nice interest.
Churn:
- How often do recommendations change
- This can measure how sensitive your recommender system is to new user behavior
- Churn can also be deceiving. High churn can be achieved by randomly selecting items like many other metrics mentioned previously. So there must be a balance, you must look at all metrics and think about the tradeoffs between them.
Responsiveness:
- How quickly does user behavior influence your recommendations
- For example if you rate a new movie does it effect your recommendations immediately or the next day after some overnight batch transform job.
- You have to decide how responsive you want your recommender system should be. Recommender systems with instantaneous responsiveness tent to be very complex, expensive to build and maintain. There needs to be a balance between responsiveness and simplicity.
Online A/B Test:
- Bar far the most important. Through online A/B test you can modify your recommender system using your real customers and measure how they react to your recommendations.
- You can put recommendations from different models in front of different users and monitor if they buy watch or indicate interest in the recommendations presented to them. By continuously testing changes to your recommender system using controlled online experiments you can see if your recommender systems causes customers to discover new items, and purchase more things then they would have otherwise.